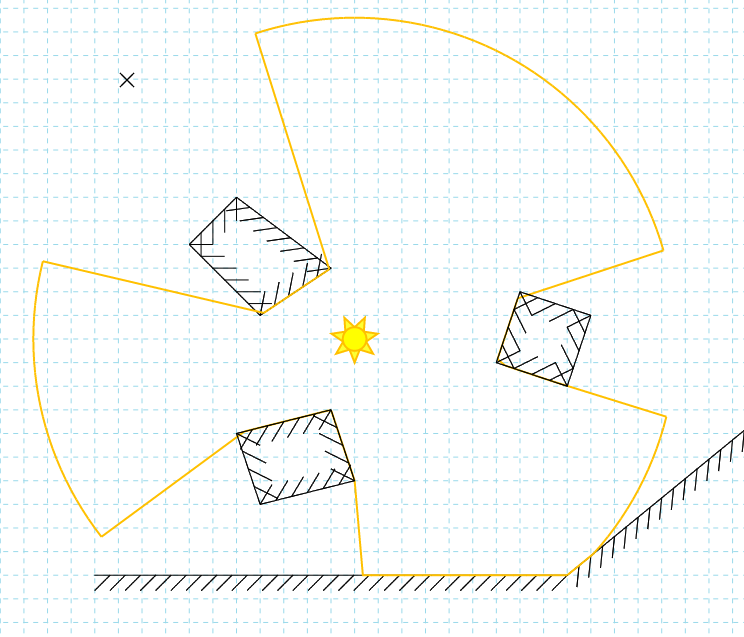
The Function Graph object in the editor allows you to plot cartesian and polar graphs of arbitrary functions. Since the functions are authored in Javascript, it’s actually quite easy to add logic and more or less arbitrary code to them, i.e. we’re not restricted to stricly maths-like functions. One of the advantages of this is that it was quite easy to expose ray hit testing results as inputs to the functions. This has allowed for some quite interesting graphs!
Category: Editor
I got tired of looking at the old ‘programmer art’ UI in the Editor, so I spent a bit of time putting something a bit nicer together. I had a look at a couple of ready make JS libraries to use, but in the end I decided to build up the little UI library I was using already. There are lots of good libraries out there, but they’re aimed at proper UI/UX people, rather than C++ programmers hacking some JS together (like I am).
There are still some improvements to come. Now that the UI is looking reasonable and has a few usage tips, I’m going to focus on making some usability changes on the drawing itself. There is a lot of functionality (typically accessed via keyboard modifiers) that isn’t very obvious. The overlay rendering (snaps, visual hints, etc) aren’t very nice either (again, programmer art!). Some of these I will address by having nicer, more intuitive graphics, and others by providing example and tutorial scenes.
You can now edit a local copy of any diagram in any of the posts! There is an option available via the right click context menu. It works by saving a copy of the diagram to Local Storage and then opening it in the Editor!
…to see if I have two embedded diagrams on the front page and check they work properly!
This is a test of the embedded diagram functionality. You should be able to zoom & pan but not edit.
Just came across Apparatus (http://aprt.us/). It’s very nice, lots of similar concepts to what I’m trying to do here. Check it out!
I’ve been adding lots of new functionality to the drawing app. We have lines, rectangles, circles, cameras, lights! Lots of snapping options as well!
Woo! After a lot of testing, head-scratching and swearing, I found the problem! I wasn’t clearing the line dash mode correctly!
I had code like this:
if (typeof(dash) === "undefined")

    dash = [1,0];
context.setLineDash(dash);
Visually, it does the right thing, draws a solid line. However I think it actually draws the line 1 pixel at a time instead!
The correct code is this:
if (typeof(dash) === "undefined")

dash = [];
context.setLineDash(dash);
Massive win!
HTM5 Canvas performance can be abysmal some times! Not all the times, not all all browsers, but often.
I’ve generally been finding Chrome to be a lot faster than Firefox, but I’m also finding some very strange performance pitfalls on both.

Check out the new light types added to the generic diagram tool! They cast shadows too!